
10 Feb Improve leak detection in noisy environments with the spectrogram view
Gas leak detection in noisy environments
Improve leak detection in noisy environments with the spectrogram view
Compressor rooms, gas turbine enclosures, pressure reduction systems – these are all environments where the ambient noise level can be damaging to our ears, and where ear earplugs are often required. How do these sounds impact the detection of gas leaks?
While Ultra Pro is not sensitive to them, they indirectly impact Ultra Pro. Ultrasounds are often created by the same processes that create audible sounds. Ultrasounds are sounds that you cannot hear, but Ultra Pro uses them to locate gas leaks.
Ultra Pro implements multiple algorithms to work, even in these noisy conditions. One of these algorithms filters out every sound that is outside of the ultrasound camera tunable detection frequency (by default set to 31 kHz, well above what the human ear is able to hear).
This article describes how to choose the best detection frequency to find small leaks even in noisy environments by using the spectrogram screen feature of Ultra Pro.
1. What is a spectrogram?
The spectrogram screen on Ultra Pro allows users to visualize sound energy present at different frequencies (0 to 60 kHz) as a function of time (for a timescale of 5 seconds). The sound level is color coded (with the legend in the lower left corner). Intense sound sources appear in red, and the quieter areas appear in dark blue.
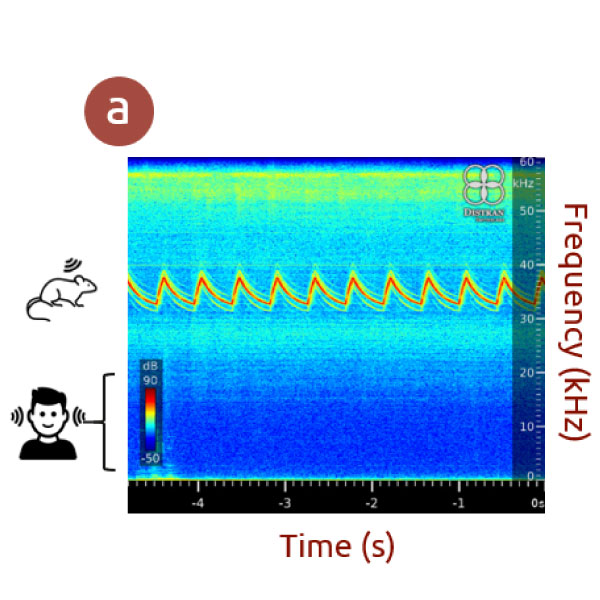
For example, in image a – on the left – you can see a spectrogram measured with the Ultra Pro camera detecting an ultrasound emitter designed to repel animals. The signal emitted is a periodic sound pattern between 30 and 40 kHz with a period of about 0.5 s. Since rodents can hear well into the ultrasound region (more than 20 kHz), they hear the sounds emitted by these devices while humans do not.
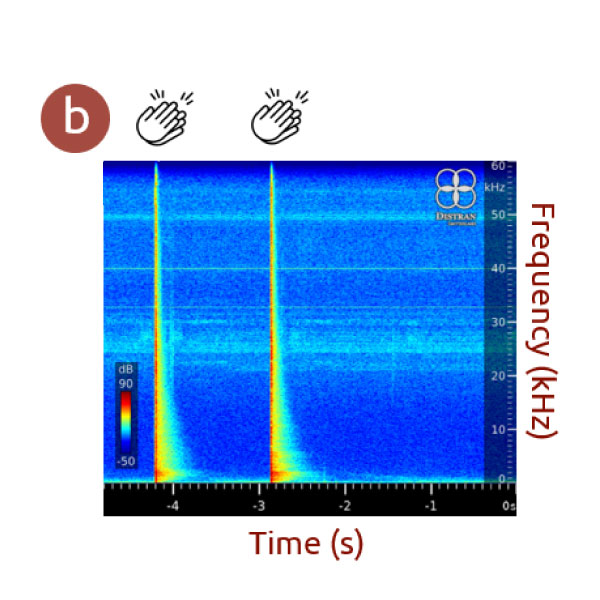
The spectrogram in image b – the center image – shows the sound pattern seen when clapping hands in a quiet room. Every time the person claps their hands, a strong and short signal appears at all frequencies.
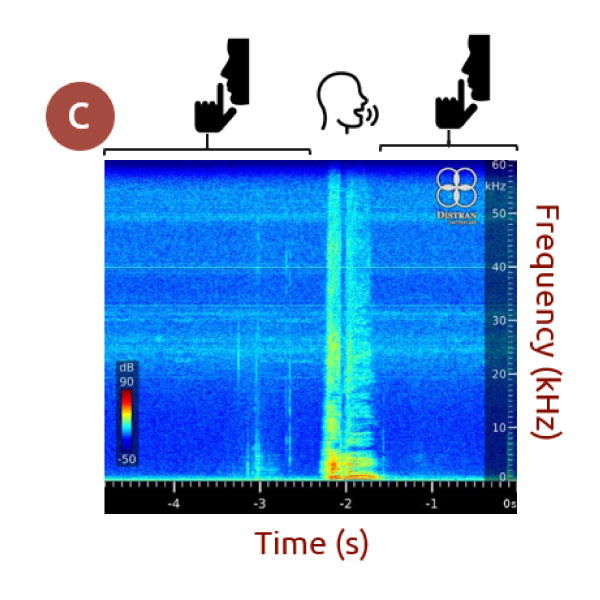
Image c – on the right – shows a typical pattern observed when someone talks. During the first 2.5 s, the room is quiet, but then, someone says, “Hello!” As you can see, even though the sound emitted by humans talking is stronger in the audible range, it effectively affects all the frequencies up to 60 kHz. For this reason, we recommend doing inspections without too many people around. Their steps as they walk around, their voices or even friction on their clothes would be detected.
On this external site, you can try a live spectrogram that transforms the audible sound recorded with your microphone (don’t forget to allow access in the browser) into a spectrogram. By clicking on the spectrogram, the app plays a sound at the corresponding pitch. Note that the frequencies used are lower (<20kHz) than those typically used by Ultra Pro (>20 kHz).
The spectrogram enables you to comprehend the surrounding sounds. This feature can guide you during a leak search, and help to optimize and improve leak detection.
–
2. What does a leak look like on a spectrogram?
Gas leaks are characterized by their emission over a broad range of frequencies. In addition, gas leak sound emission does not change in time, in contrast with the human voice example displayed above.
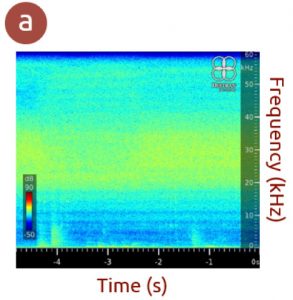
For example, a leak spectrum in a quiet environment is shown in image a – on the left. The sound level emitted by the leak is at its maximum in the region between 20 and 40 kHz. Therefore, any frequency in this range would be suitable for detecting this leak.
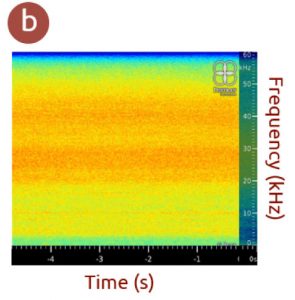
Image b – on the right – is an example of a louder gas leak (as we can see by the orange color) in a noisier environment (shown in yellow).
3. How to pick a suitable detection frequency?
Our experimental tests indicate that 31 kHz, in general, is a suitable detection frequency for a leak search in industrial environments. For this reason, 31 kHz is the default detection frequency when the camera is turned on.
This can be understood by looking at the image below. The red line represents the typical spectrum of a gas leak, i.e. the sound level emitted by a gas leak as a function of frequency. A spectrum can be thought as a “slice” of a spectrogram cut at a given time (one column). The typical spectrum of the sound coming from rotating equipment, usually present in most industrial plants, is displayed in grey. As we can see, machinery noise is characterized by its emission in the lower frequency side of the spectrum, decreasing in intensity from about 25 kHz onward. In contrast, gas leaks at pressurized systems usually show a maximum in sound intensity between 30 and 40 kHz. As we want to avoid picking up the noise emitted by rotating machinery during inspections, which can disturb and even prevent the detection of gas leaks, we normally avoid detecting at frequencies lower than 25 kHz.
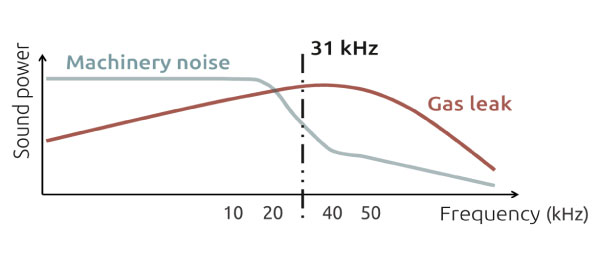
The reason for choosing 31 kHz and not a higher frequency is that the absorption of sound waves by air is stronger for higher frequencies. High frequency sound waves attenuate more rapidly as a function of distance. This is actually the reason why many big animals such as elephants or whales use infra-sound (even lower frequencies than the acoustic range) to communicate over vast distances. Therefore, 31 kHz is chosen as the default detection frequency as a good compromise between:
– avoiding environmental noise,
– being at the maximum of the gas leak emission,
– avoiding higher frequencies that get more strongly absorbed by air.
While 31 kHz works well in most cases, some particular situations require a change in detection frequency.
In some environments, background noise can be intense around the 31kHz region, and it may be beneficial to change the detection frequency.
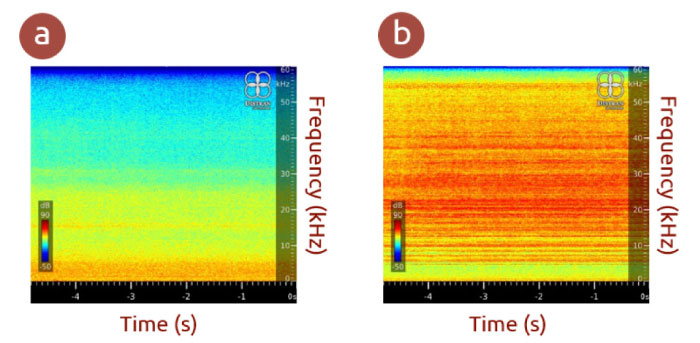
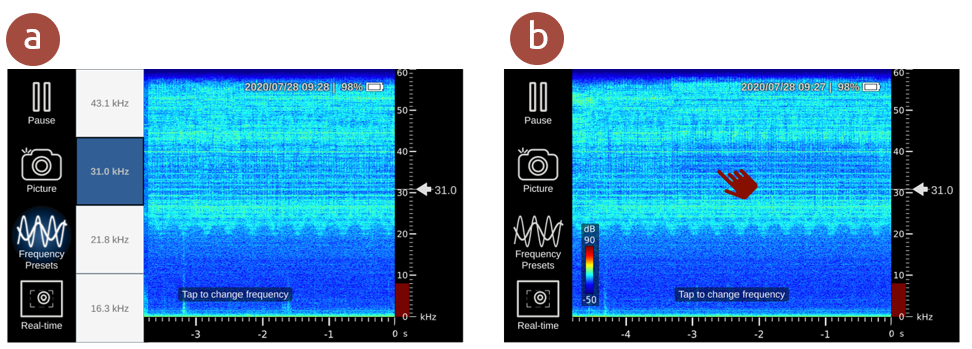
The images below show two examples of machinery noise being detected by the camera. In image a – on the left – the noise affects mostly the low frequency range of the spectrum. In this case, a detection frequency higher than 30 kHz would be recommended.
In image b – the spectrogram on the right – all frequencies are affected by a very strong machinery noise. Trying a detection frequency within a yellow (quieter) band, would be an option. However, in this case, a change in the detection frequency would (likely) marginally help with detecting gas leaks. Instead,we would need to inspect while keeping the perturbing source on the back of the camera. Alternatively, the perturbing source could be covered – to attenuate the noise.
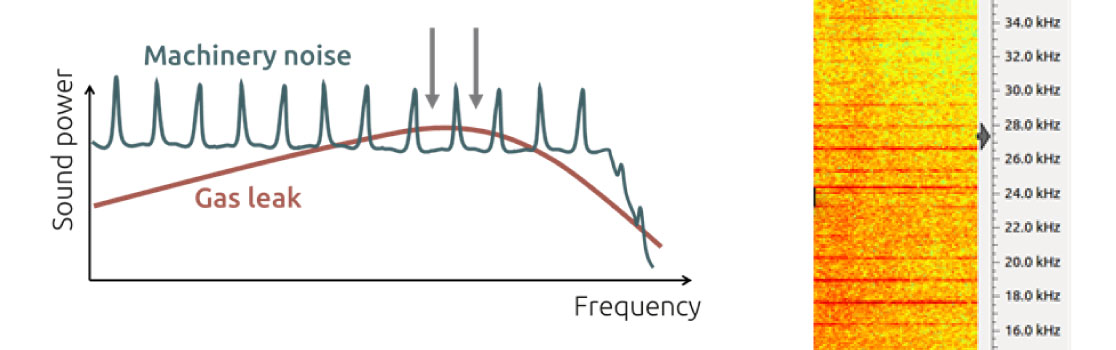
Sometimes, on the machinery noise spectrum, we can distinguish the harmonics. The harmonics of a sound wave are waves with a frequency that is a positive integer multiple of the original frequency wave which is known as the fundamental frequency.
Most sound sources emit sound at more than just one single frequency. For example, playing an A4 note on a clarinet will result in energy being emitted mostly at the note’s fundamental frequency 440 Hz and its harmonics, i.e. 880 Hz, 1320 Hz, 1760 Hz, 2200 Hz, etc. The same can happen for machinery noise.
This effect is sketched below – on the image on the left – where we can see how the spectrum from machinery noise is composed of several equally spaced bands. When a gas leak is under the presence of rotating equipment producing a harmonic spectrum like the one below, a frequency between the harmonics should be selected. This will minimize the contribution of the machinery noise, giving us more chances to detect the gas leak.
The image on the right shows a real-life example of this scenario. The broad band distribution of the gas leak is under the presence of the harmonics of rotating equipment. They are represented as the equally spaced loud bands in red.
Some leaks, such as vacuum leaks, have a spectrum that differs from typical leaks, and their sound is not maximal at 31kHz. Thus, changing the detection frequency may improve the detection.
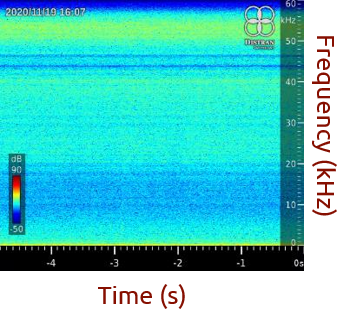
As shown below, a leak emitting at frequencies higher than 50 kHz is observed, and therefore the detection frequency should be changed to a value higher than 50 kHz.
Note that while using such a high frequency, you will mostly see sound sources close to you due to ultrasound absorption by the air.
–
4. How to change the detection frequency on the spectrogram screen?
To improve leak detection, follow these few steps:
Before changing the frequency, go into the acoustic imaging mode, select a fixed focus distance (e.g 1m) and note down the current average lower detection limit (lower left number, in L/h or in dB if you haven’t selected any gas).
Back in the spectrogram menu, tap on the desired frequency (as shown in image b – on the right). Alternatively you can use the frequency presets (as shown in image a – on the left). The camera will choose the most quietest frequency within the finger width. After confirmation, the camera will switch to the new frequency (it can take some time, especially if you are in auto-focus mode).
Back in normal acoustic mode, check the lower limit of detection. If it is lower than before changing the frequency, then you successfully tuned the camera and are ready for a more precise inspection. Do not forget that the sound environment changes quickly, especially when changing rooms. You might have to redo these steps often.
- The spectrogram feature of Ultra Pro enables you to improve leak detection in the noisiest areas.
- With the spectrogram, you get an overview of the sound environment. You can then select the optimal detection frequency for your leak search.